November 2023: Corporate growth over the medium and long term
In 2023
- December 2023: HDFC Bank- when elephants dance
- November 2023: Corporate growth over the medium and long term
- October 2023: Margin of Safety – central to investing
- September 2023: Mid-caps and small caps are quite the rage in Indian markets
- August 2023: A look at the June 2023 corporate results
- Will the US economy have a soft landing?
- Nifty at an All Time High
- Growth has slowed over the last 4 years
- Competitive edge is at the heart of company selection
- As banks fail around the world, Indian banks seem safe
- Poor corporate governance can invalidate an investment hypothesis
- January 2023: Momentum Investing vs Value Investing
Charlie Munger, a doyen of value investing, passed away on 28th November, just a month or so short of completing 100 years on this planet. It is hard for us to express in words, the loss we feel, on hearing the news because Charlie was a guru to us and an inspiration, and we learned so much from him – not only how to invest, but also how to think. Charlie, you will be deeply missed! One of Charlie’s quotes which made a deep impact on us:
“Spend each day trying to be a little wiser than you were when you woke up. Day by day, and at the end of the day if you live long enough, like most people, you will get out of life what you deserve.”
Now, on to more mundane things – which is, how corporates in India have been performing in the more recent past and how does it stack up over a longer period. We looked as usual, at the non-financials in the BSE500 most of whom have reported for the September quarter. While revenues are flat yoy, EBIT is up strongly at 57.5%. The energy sector, has seen its profits more than triple on a yoy basis. Excluding that too, the revenue growth is 4.2% and the EBIT growth is 30.7%. Over a 4-year period, revenues are up 12.5% and EBIT growth is 19.9%. Excluding the energy sector, the EBIT 4 -year CAGR is still a very healthy 16.8%.

EBIT has improved remarkably over the last 4 years as corporates have managed to pass on the cost increases to their customers. How does the longer term (10 and 20 year) picture look? We decided to look at the earnings per share (EPS) data that the BSE releases daily for the Sensex and the BSE500. We must add a caveat here that the constituents of an index keep changing over time – often stocks come in to the index after they have done well for a period, and stocks go out when they have done badly for some time. This may distort some values when estimating long term earnings growth for the corporate sector, but mostly these changes happen only to the marginal stocks in the index.
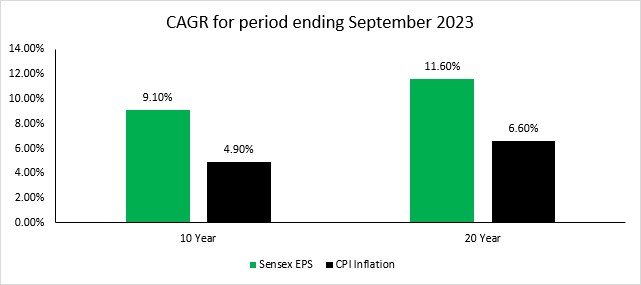
For the BSE Sensex, its reported EPS has grown at 9.1% over the last 10 years. When we look at the BSE500, its EPS has grown at 8.9% over the same period. Over a 20-year period, the Sensex EPS has grown at a higher 11.6%. We have to keep in mind here that there is a link between nominal GDP growth and earnings growth for corporates and historically they have been closely aligned. Since nominal GDP growth consists of real growth plus inflation, this reporting would not be complete without adding the inflation numbers during this period. The cumulative CPI inflation over the last 10 years (Sep 2023 is the end date) is 4.9% per annum while CPI inflation over the 20-year period is 6.6% per annum. For the inflation calculation, we have used 2 datasets. Data from 2003 – 2011 has been sourced from the Labor Bureau, Govt. of India, which publishes CPI for Industrial workers. Data from 2012 to 2023 has been sourced from CPI numbers released by the Ministry of Statistics and Program Implementation. We have done this in order to have meaningful longer-term data.

What one can conclude from this data is that the last 10 years has seen slower earnings growth than the past and while some is due to lower inflation, some of it is due to slower economic growth. Reasons one can think of, for lower growth in the last 10 years, is some unexpected events like demonetisation, the ILFS crisis and the covid lockdowns. However, the last 10 years also saw some significant reforms like GST, Insolvency and Bankruptcy Code (IBC) and RERA. We also saw a clean-up of the banking sector, which allows banks to adequately fund the future growth of the economy. We therefore expect future economic and corporate growth to revert to the mean and grow at a faster pace than it has done over the last 10 years.
While the EPS growth for the Sensex is 9.1%, the price growth for the index is 12.4% per annum over the last 10 years. The PE of the Sensex was 17.6 ten years ago and it is now 23.7. Over the last 30 years the Sensex has traded between 16.2x and 23.6x earnings at the median of the lows and the highs. So, over the last 10 years, price growth has outstripped earnings growth as the Sensex has moved from the lower end of the valuation range to the higher end of the range. It is likely that much of the rerating of the Indian markets is over and future growth in the index will be more linked to the earnings growth reported in the future.
