November 2024: A glimpse into Sep-24 quarterly earnings
In 2024
- December 2024: The primary market – the raison d’être of the secondary market
- November 2024: A glimpse into Sep-24 quarterly earnings
- October 2024: Weak Market Internals
- September 2024: Implications of Fed rate cut
- August 2024: BSE500 constituents trading at elevated valuations
- July 2024: Higher taxation to impact intrinsic value
- June 2024: Risks to the market and our process to handle them
- May 2024: Corporate Results Trends over the last 10 years
- April 2024: Our investment process explained through AMCs
- March 2024: Market cap to GDP – where is India in terms of valuation
- February 2024: Patience – a virtue in the investment journey
- January 2024: Party continues for mid caps, small caps and PSUs
This month we will do our regular review of the quarterly results for the September 2024 quarter. To do an apples to apples comparison, we look first at the non-financials in the BSE500 and within that those companies that were listed 5-6 years ago and whose numbers are available. 364 out of the 430 non-financials make the above cut and these 364 represent 92% of the total market cap of all non-financials in the BSE500. Below we present the revenue and EBIT growth.

Revenue growth is tepid – over 1Y and 6Y basis with the 3Y number more in line with long term nominal GDP growth. The EBIT growth on a yoy basis comes as a bit of a shock (-ve 12%), particularly in the context of the high valuations that had been prevailing in the market until 30 Sep 2024. However, if we exclude the energy sector, which has been particularly hit, the EBIT growth would be 4%.
We have got feedback from clients about our focus on performance of non-financials in the BSE500 when we currently have a large weight in financials in our portfolio. Our defence has been that financials are really a derivative of the real economy and our intention of looking at non-financials was an attempt to understand what is happening in the broader economy. However, we have taken the feedback and we will now talk about banks within the BSE500 (We have excluded NBFCs and insurance companies because of difficulty of common comparison). Here we are doing a 10 year analysis – so we have included only those banks in the sample which were listed 10 years or were present in some other form. The erstwhile HDFC Ltd which is now merged with HDFC Bank, is included in the base and the effect of all the PSU bank mergers is also reflected in the numbers.

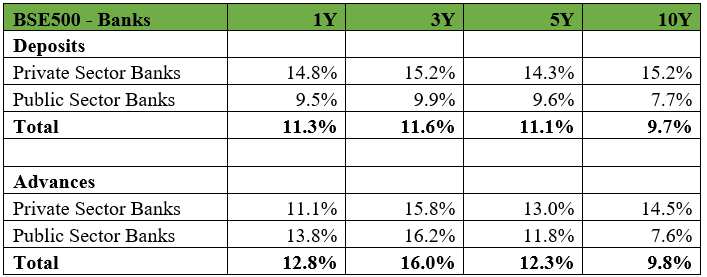
One of the important things to look at, in a bank is deposits growth because long term lending growth is to a large extent determined by deposits growth, though banks can resort to relatively more expensive borrowings to meet short term loan growth targets. While long term (10Y) deposit growth remains a tad weak, we can see that private banks have beaten their PSU counterparts handsomely on this count on all timeframes. While over the long term deposit and loans growth are equal, over the short term, loan growth has outstripped deposits growth, creating pressure on banks to up deposit rates, thus impacting margins.
On the advances side, PSU banks have been more aggressive than private banks over the 1Y and 3Y timeframes though over the longer 5Y and 10Y horizons, private banks continue to grow faster and gain market share.

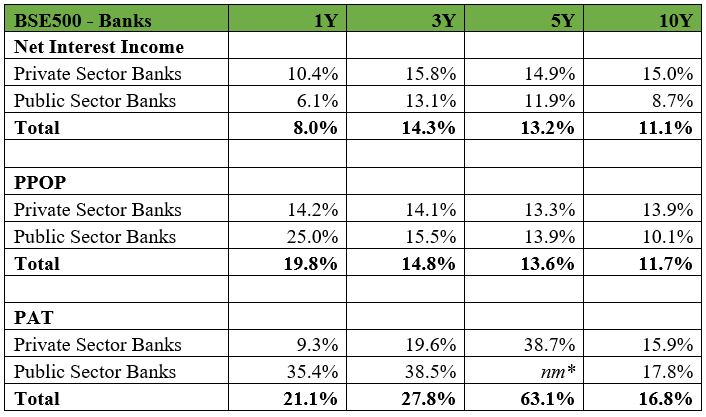
*not meaningful as divisor is negative
Just to explain some of the terms above:1) Net interest income (NII) which is interest income received minus interest paid 2) Pre-provisions operating profit (PPOP) which is the total profit of the bank before provisions for doubtful debts and tax. On the NII front, private banks have done significantly better than PSU banks over all timeframes. However, on PPOP and net profit, PSU banks have done particularly well, especially on the shorter timeframes. The PPOP growth is higher because the big daddy SBI records its gains from recovery of doubtful debts in other income. Also a fall in staff expenses (related to retirement related costs) has boosted SBI’s PPOP in the short term. Net income growth has been very strong for PSU banks because in the base periods, the PSU banks were sitting on a large amount of bad loans which eroded their profitability in the base years. As the credit cycle has been benign over the last few years, the PSU banks have got a lot of recoveries of their bad loans, in turn giving them write-backs on provisions, thus making for strong net profit growth in the near term. Signs are now emerging that the credit cycle may not remain as benign. When stress emerges at some point, there may be a greater discernment from the market about good quality and poor quality banks.
While the financials have reported better performance than the non-financials in recent times, it is surprising that financials have been relative underperformers in the Nifty and in our judgement, some of the financials we own are trading at very reasonable valuations. Thus, they have a large weight in our portfolio. The quarterly results of the non-financials are disappointing in the context of the valuations that the non-financials are trading at, and we have taken a cautious view here in our portfolio strategy.
